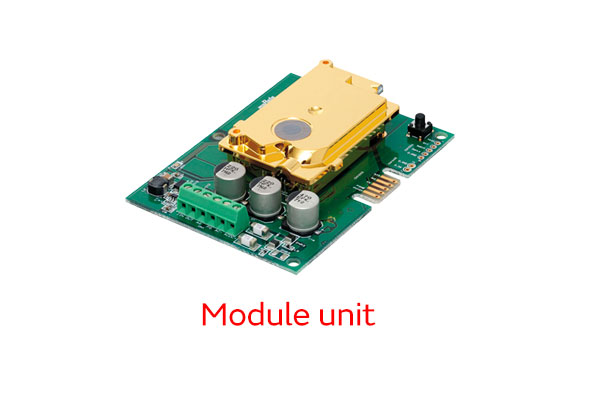
CO2 sensor
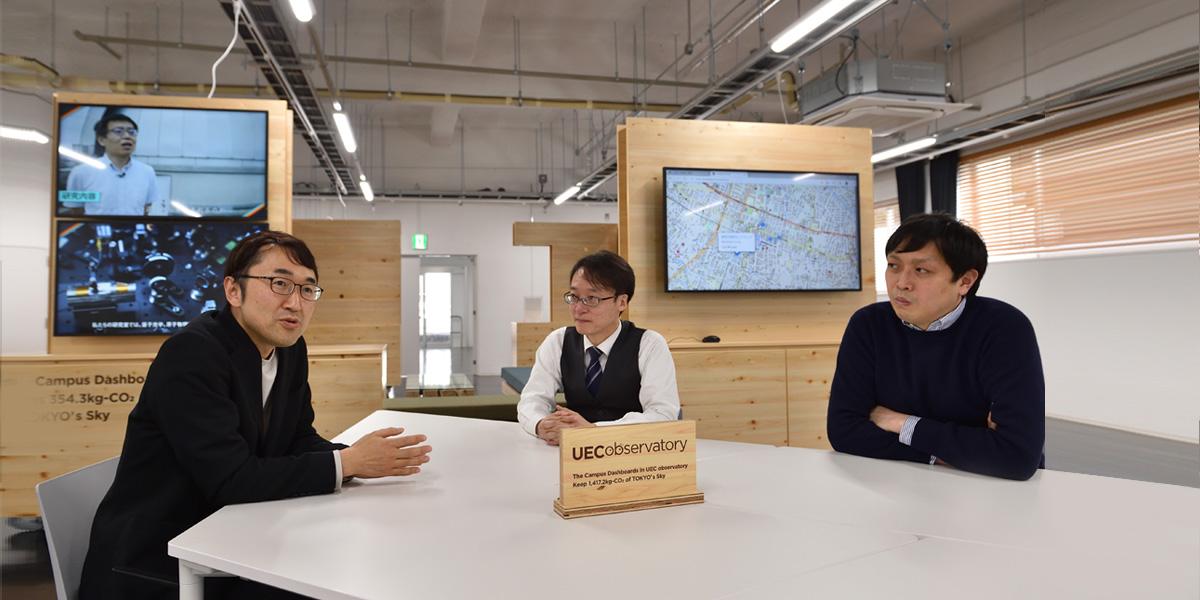
The COVID pandemic that began in 2020 is showing no signs of coming to a close. For society to recover and progress in this post-pandemic era, the thing we need most is to reduce the risk of infection at schools, offices, and other places where people gather. The key is avoiding the three Cs: closed spaces, crowded places, and close-contact settings. It is especially important to avoid closed spaces, something we can accomplish through proper ventilation, to prevent aerosol transmission (airborne infection). In the second part of this two-part series, two Murata Manufacturing employees—Mr. Imagawa, who is in charge of spatial visualization solution development, and Mr. Dan, who is in charge of CO2 sensor development—asked Dr. Yo Ishigaki, a project associate professor at the graduate school of the University of Electro-Communications, about how to choose CO2 sensors as an indicator of ventilation, and how to visualize air quality, and more.
--In the first part, we talked about the importance of ventilation to prevent aerosol infection, and also about CO2 concentration as an important indicator of ventilation. CO2 concentration is measured by sensors, correct?
Dan: The surprising thing about CO2 sensors is the fact that people were buying them even though some were hardly worthy of being called CO2 sensors.
Dr. Ishigaki: You are referring to the case we reported on a news program on TV last August, right? I conducted a study and was amazed by the results.
Imagawa: We, too, were very surprised by your findings.
Dr. Ishigaki: We conducted an experimental study in which we purchased around a dozen CO2 sensors with a retail price of 5,000 yen or less from an online retailer. We found that roughly 60% of them were incapable of accurately measuring CO2. We issued a press release to share our findings, and it made the news on TV and even caught the attention of some Diet members. Eventually, Japanese government agencies created guidelines. Consequently, the devices that purported to measure CO2 concentration gradually disappeared from the market. The instruments were fitted with cheap gas sensors that react to various volatile organic compounds (VOCs), and the manufacturers claimed that the instruments were able to estimate the CO2 concentration from the overall gas concentration. Notably, the CO2 sensors approved under the government guidelines are the optical type.
Dan: CO2 concentration cannot be measured correctly without optical sensors, specifically nondispersive infrared (NDIR), photoacoustic, or some other established method of sensing.
--Consumers may have difficulty deciding which CO2 sensors to purchase. First of all, should we assume that sensors are reliable as long as they are optical?
Dr. Ishigaki: Before buying anything, the key is to select NDIR or photoacoustic sensors as the Japanese government guidelines recommend. After making the purchase, blow on the sensors. The numbers should go up. Then, put the sensors near some alcohol. The numbers should not move. Another determining factor is whether there is a clear description of the sensors’ calibration function.
Dan: Calibration is the correction of deviations in measured values, either automatically or manually. The readings of CO2 and other gas sensors gradually deviate as the instruments are used. The sensors’ calibration function corrects these deviations. In fact, deviations begin to appear after about six months of use, becoming fairly large after one year. This is why sensor values are generally corrected through calibration, for example during legally mandated inspections. Our company originally developed CO2 sensors for agricultural use. CO2 concentration directly affects plant growth, so we mass produce our sensors with long-lasting stability and accurate automatic calibration. Our design also eliminates the effects of varying humidity and other atmospheric changes attributable to factors other than CO2, which are often overlooked as the causes of errors in CO2 concentration measurements.
--CO2 sensors should accurately measure CO2 concentration and have a calibration function. Is there anything else to keep in mind when purchasing CO2 sensors?
Dr. Ishigaki: Most devices display CO2 concentration as a number. The display could say 800 or 1,100, but who would be able to immediately recognize the difference? If the product is intended for adults, messages such as “Good air quality” should be easy enough to understand. If the product is intended for use by young children, smiley faces and other animations may be more intuitive.
Imagawa: It is important to consider who is reading the display. In stores, the devices are often placed at the end of a counter or near the register, apparently to reassure people at the end of their shopping experience that it was safe. Customers probably want to know whether it's really safe a little sooner than that.
Dr. Ishigaki: I have advised restaurants and other stores to work their way to visualization methodically, in three steps. For the first step, rather than showing numbers to customers right out of the gate, managers should develop a firm understanding of trends in CO2 concentration. This can take around a week of observing trends such as the time periods that see higher concentrations each day. Then and only then can ventilation measures be considered. If the concentration is always at or below 1,000 ppm, the space is generally safe, but if it gets crowded, the concentration could exceed 1,000 ppm. The second step is to instruct staff members to always check the numbers during busy times. If the CO2 concentration exceeds 1,000 ppm, mechanical ventilation is insufficient. Therefore, it is necessary to train staff members to open windows for natural ventilation if the figure exceeds 1,000 ppm. Once a restaurant or store is confident that they are doing everything they can to keep the air clean, they can proceed to the third step, which is sharing the numbers with customers to demonstrate their commitment to safety.
Dan: Using sensors to show customers that spaces are properly ventilated can backfire if the concentration exceeds 1,000 ppm because customers will complain instead of feeling reassured.
Dr. Ishigaki: If staff members are not well trained, they will get flustered, and if they end up causing trouble, all the effort will be for naught. Conversely, if restaurants and stores introduce sensors properly, the state of ventilation can be visualized across entire towns. The city of Chofu, where the University of Electro-Communications is located, is implementing the Chofu Safe Air Project (Japanese only) under which it lists restaurants with clean air.
--How should CO2 sensors be used in schools and other institutions?
Dr. Ishigaki: The textbook approach is for teachers to show the readings to students and encourage them to modify their behavior accordingly. However, since the students are there to learn, it may be a good idea to ask them to consider what to do. CO2 sensors can be used as a means of environmental education. For example, students can conduct a science experiment in which they measure changes in CO2 concentration and consider the reasons, or during art time, they can think about the design of the alert displayed when the concentration increases. With AIRSual by Murata Manufacturing, various sensors can be added, for example an IoT system that senses when a classroom door opens or closes and plays a sound. These are just some ideas that could be used in lessons under the immensely popular GIGA School Program and the environmental component of STEAM education. The great thing about AIRSual is that it can be expanded in so many different ways.
--What are your thoughts about AIRSual’s forecasting function, which seems to be quite user friendly?
Imagawa: Our spatial visualization solution AIRSual is the only CO2 sensor with a forecasting function. We have developed a patent-pending algorithm that can accurately predict the CO2 concentration five minutes or even an hour into the future. To predict CO2 concentration, several parameters must be taken into account, for example the volume of the space, the number of people in it, and the ventilation capacity. First, we collect a week’s worth of data. Then, we combine it with machine learning and other methods to produce highly accurate forecasts.
Dan: This goes without saying, but the accuracy of the forecasts depends significantly on the accuracy of the data collected. Inaccurate data leads to inaccurate forecasts. This is why we expend every effort to achieve the utmost accuracy with regard to the sensors that collect the data.
Click here for details about AIRSual, Murata’s spatial visualization solution (Japanese only)
--Finally, Dr. Ishigaki, what are your expectations for the near future, when air quality is properly visualized?
Dr. Ishigaki: If air quality can be displayed digitally, we can expect that it will help control aerosol transmission. Furthermore, the tourism industry should benefit from the consistent introduction of CO2 sensors under tourism DX in the post-pandemic era. I also expect air quality visualization to contribute to environmental education, and eventually to be a part of Japan’s international aid for achieving the SDGs. I hope that Murata Manufacturing proactively communicates the importance of visualizing air quality to the world.
Dr. Yo Ishigaki
Dr. Ishigaki is an expert in risk informatics. He studies methods of measurement and visualization to help people perceive risks correctly. He received a doctorate in engineering from the University of Electro-Communications and a master’s degree in art from Tama Art University. He researched and developed security systems for 10 years at SECOM Intelligent Systems Laboratory. Afterward, he commercialized Pocket Geiger, the world’s first smartphone-connected radiation detector; Pocket PM 2.5 Sensor, a device that visualizes air pollution; and Pocket CO2 Sensor, a device for visualizing the three Cs. He has also developed many pieces of medical and sanitary equipment. Dr. Ishigaki has received numerous awards, including the Minister of MEXT Award of the Local Commendation for Inventions, the Japan Prize, the Heisei Memorial Research Grant Award, the Good Design Award, and the RedDot Design Award. He has made numerous media appearances, calling for risk-averse behavior to prevent aerosol transmission.
Design for Humanity (Japanese only)