Wireless Sensing Solution

A smart factory is a factory that achieves operational process improvements, higher quality, and lower costs based on digital data by connecting processes from design to development, manufacturing, and maintenance in a network. In the manufacturing industry, it refers to automating various processes in a factory to realize product quality and productivity improvements, a reduction in manufacturing costs, a shortening of the commercialization, mass production and delivery periods, and other areas of improvement. In other words, a smart factory is a factory working on digital transformation (DX) that aims to transform the entire business process from design to manufacturing, maintenance, and logistics in addition to improving productivity by automating factory equipment.
We introduce here the results of a questionnaire survey* we conducted with people involved in promoting the conversion of regular factories into smart factories in the manufacturing industry in Japan.
*About the Questionnaire Survey
Organization conducting the survey: Murata Manufacturing Co., Ltd.
Survey targets: 11,084 workers in the manufacturing industry in Japan (screening survey) and 500 people working in the manufacturing industry who are involved in converting regular factories into smart factories in their companies (main survey)
Survey method: Internet survey
Survey period: Three days from January 25 (Wed.) to 27 (Fri.), 2023
*Total figures may not match due to rounding.
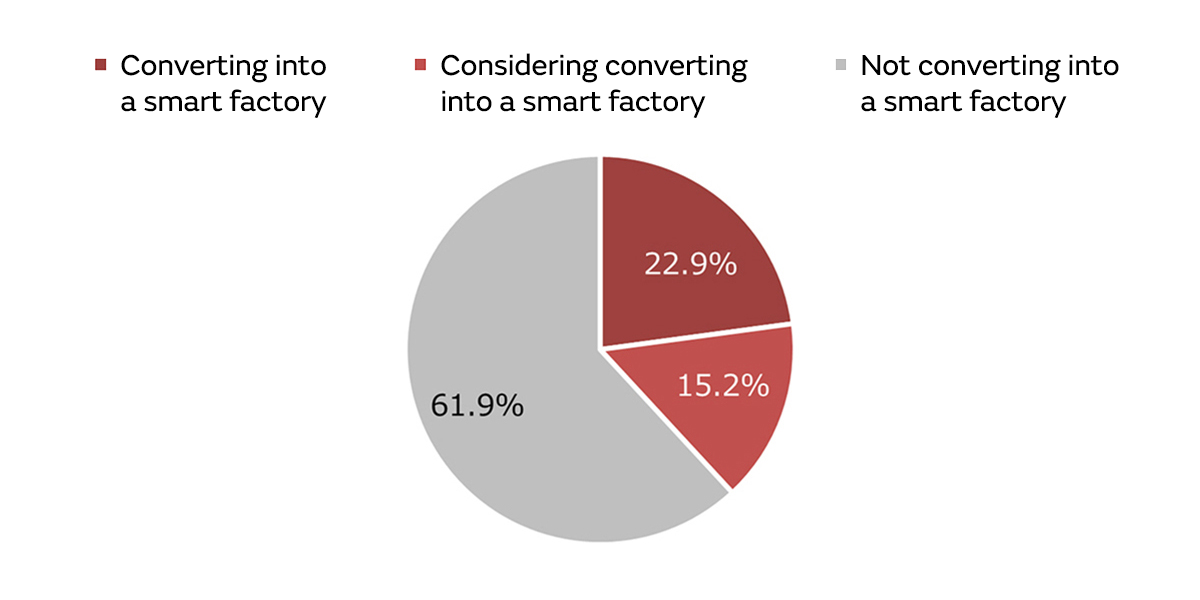
We learned that over 38% of factories are in the process of converting into smart factories or considering converting into a smart factory in the questionnaire we conducted this time (Fig. 1). We can see a trend for even more companies to convert their regular factories into smart factories in the future.
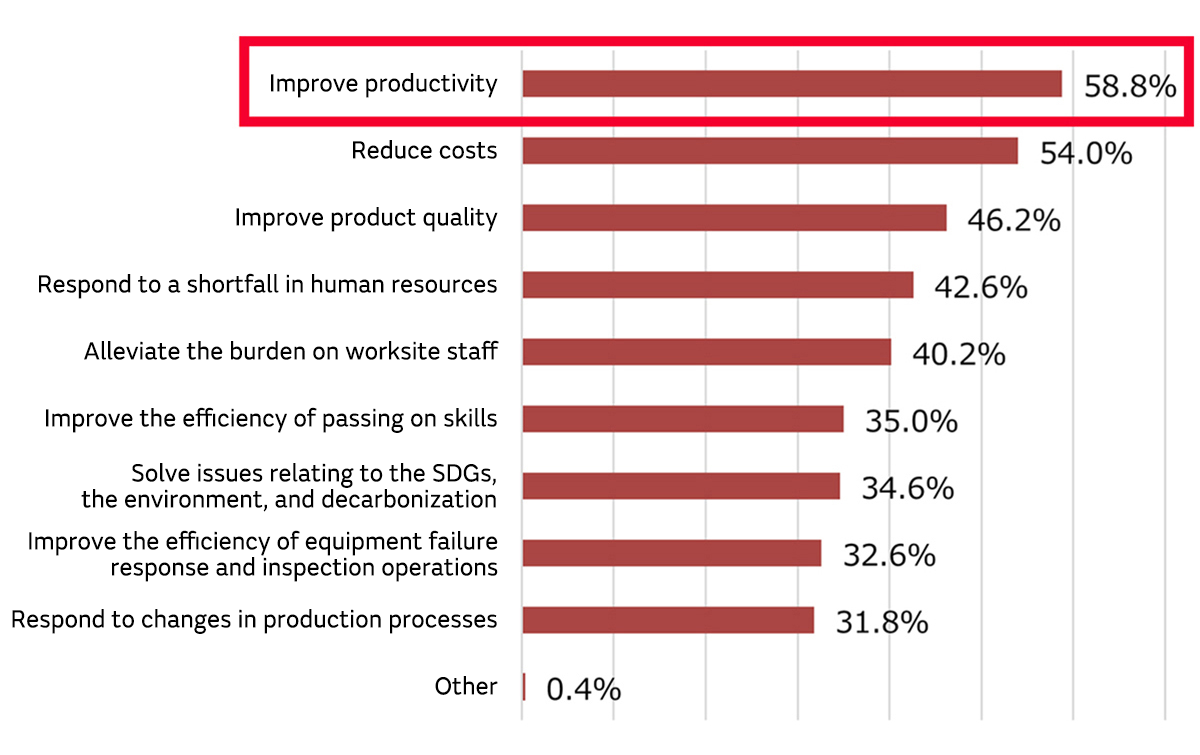
Moreover, the most common reason for converting regular factories into smart factories is to improve productivity. The next most common reason is to reduce costs (Fig. 2).
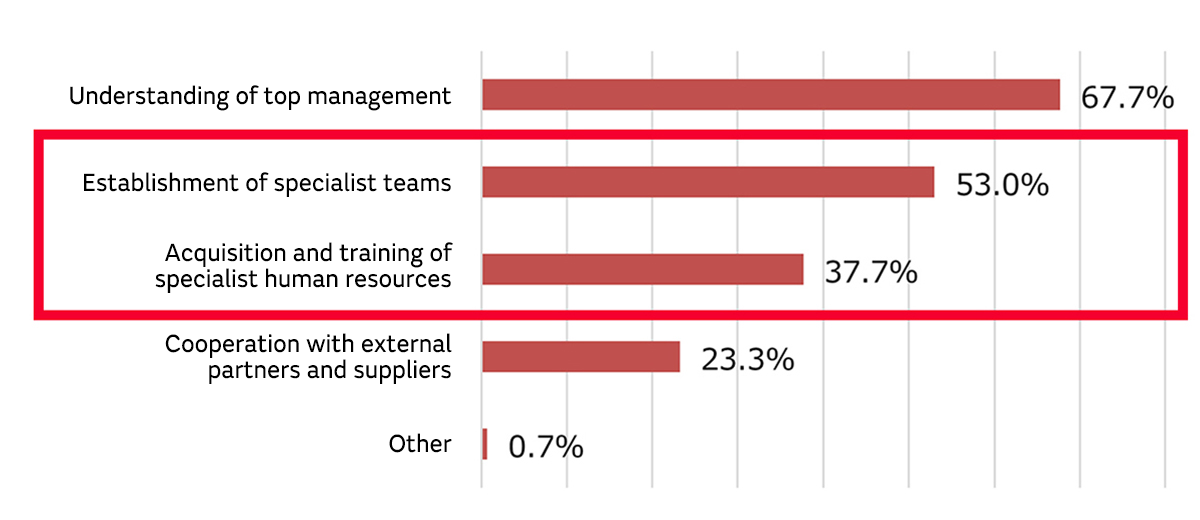
On the other hand, the following are given as the main factors behind the inability to promote conversion of regular factories into smart factories: following on from the understanding of top management, the establishment of specialist teams, the acquisition and training of specialist human resources, cooperation with external partners and other human resources and know-how shortage issues (Fig. 3).
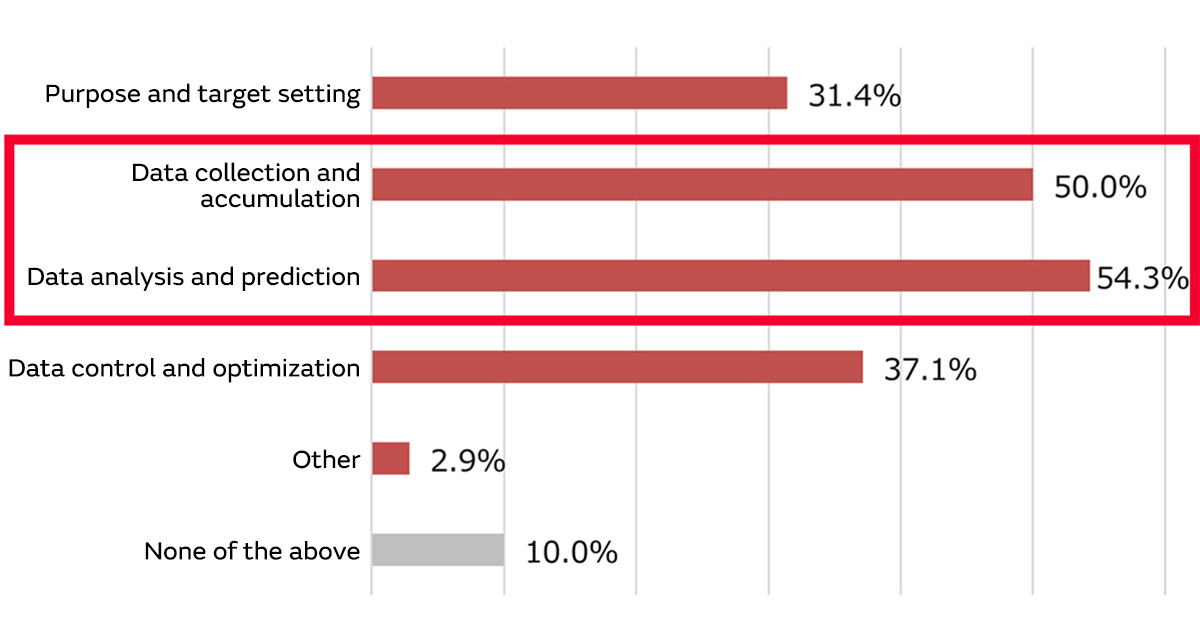
In addition, we learned that even factories working to convert into smart factories are suffering setbacks in terms of data analysis and prediction and data collection and accumulation (Fig. 4).
It is thought that how to overcome these steps will be the key to promoting the conversion of regular factories into smart factories. We will consider these issues using the example of short stoppages, which are one type of equipment loss that are a major factor adversely affecting the productivity of smart factories, from here onward.
Equipment loss arising in each process is a major issue that must be resolved for the conversion of regular factories into smart factories that greatly contributes to improving productivity in factories.
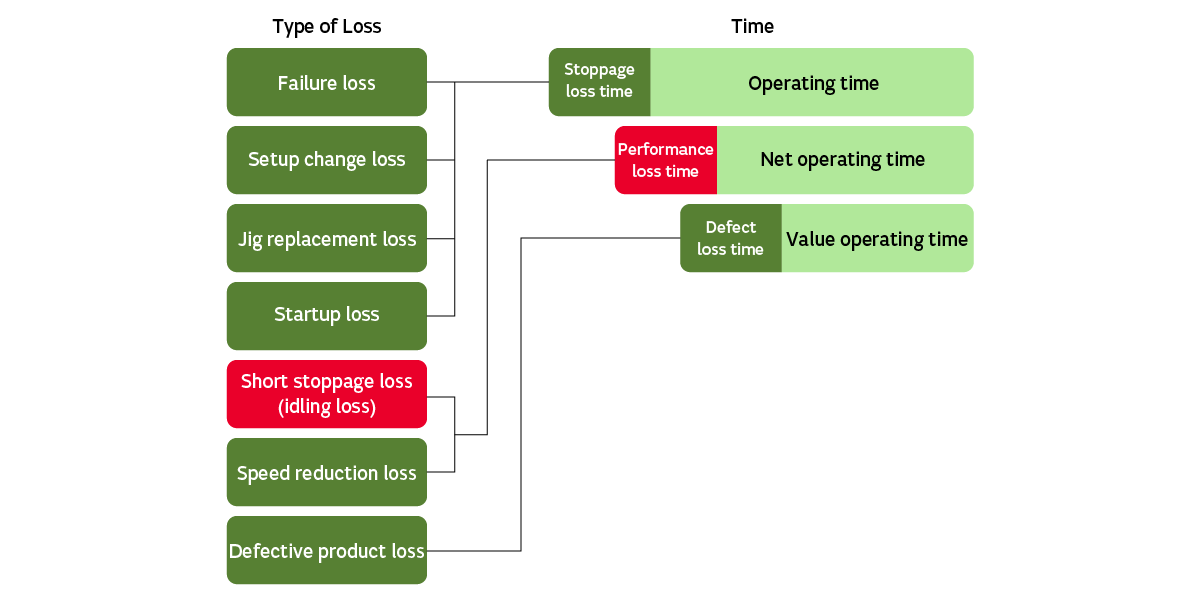
The types of equipment loss include stoppage losses resulting from failures, setup changes, jig replacements and startup, defective product losses, speed reduction losses, and short stoppage losses. In particular, short stoppages are called idling losses and are losses included in the time when, in principle, the equipment could be demonstrating its performance (net operating time) (Fig. 5).
Setup change, jig replacement, and startup losses are planned. In addition, as it takes a long time to recover from failure losses, we keep a record showing the operational status. However, short stoppages occur unexpectedly on the line and workers at the worksite recover from it and resume work in a short time. The shortness of this time until recovery means that a record of these short stoppages is not kept in most cases. Furthermore, even if attempts are made to keep records of short stoppages, there is currently no time to do so because a speedy recovery is sought.
If we do not record the time of a short stoppage, the operating rate is calculated without including that time. Accordingly, a difference arises with the actual operating rate. Furthermore, the cause of long equipment stoppages such as failure losses may be lurking in short stoppages. It is possible to see cases in which problems in the operating rate due to such short stoppages are overlooked even in factories that have been converted into smart factories.
Many industrial robots and automatic machines are installed in the manufacturing lines of smart factories. These comprise precision components. It is not possible to avoid a decline in their precision due to the usage burden and degradation over time. If the precision of these components declines, malfunctions may occur. For example, an industrial robot may fail to grip work or a deviation may arise in the trajectory of a robot arm and it may not be possible to move the part equivalent to the fingers of the robot called the end effector to the correct position. Such malfunctions may cause short stoppages.
Why are short stoppages, which cause various problems in factories in addition to obstructing improvement in productivity, not eliminated? The reason is that in the midst of frequent short stoppages on a daily basis, there is an atmosphere in which manufacturing worksites do not take the situation seriously.
The most effective way to prevent such a situation is to calculate and visualize the losses from short stoppages. However, we would need to enter the process, cause, and equipment stoppage time on a worksheet each time such a short stoppage occurs and then aggregate that data to calculate it, which would interfere with production. Moreover, it is difficult to identify the cause of short stoppages by collecting data once a week or once a month.
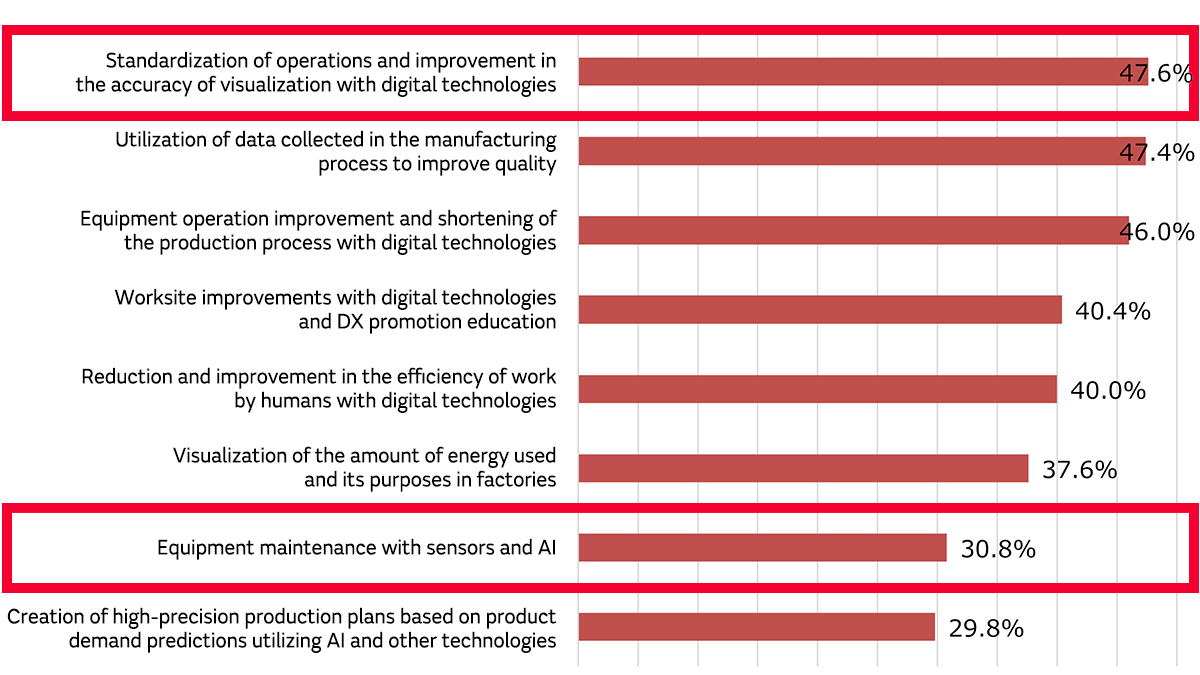
We obtained results from the questionnaire showing that standardization and visualization using digital technologies and optimization of equipment maintenance with sensors and AI are effective ways of resolving such problems in factories which have been successful in promoting their conversion into smart factories (Fig. 6).
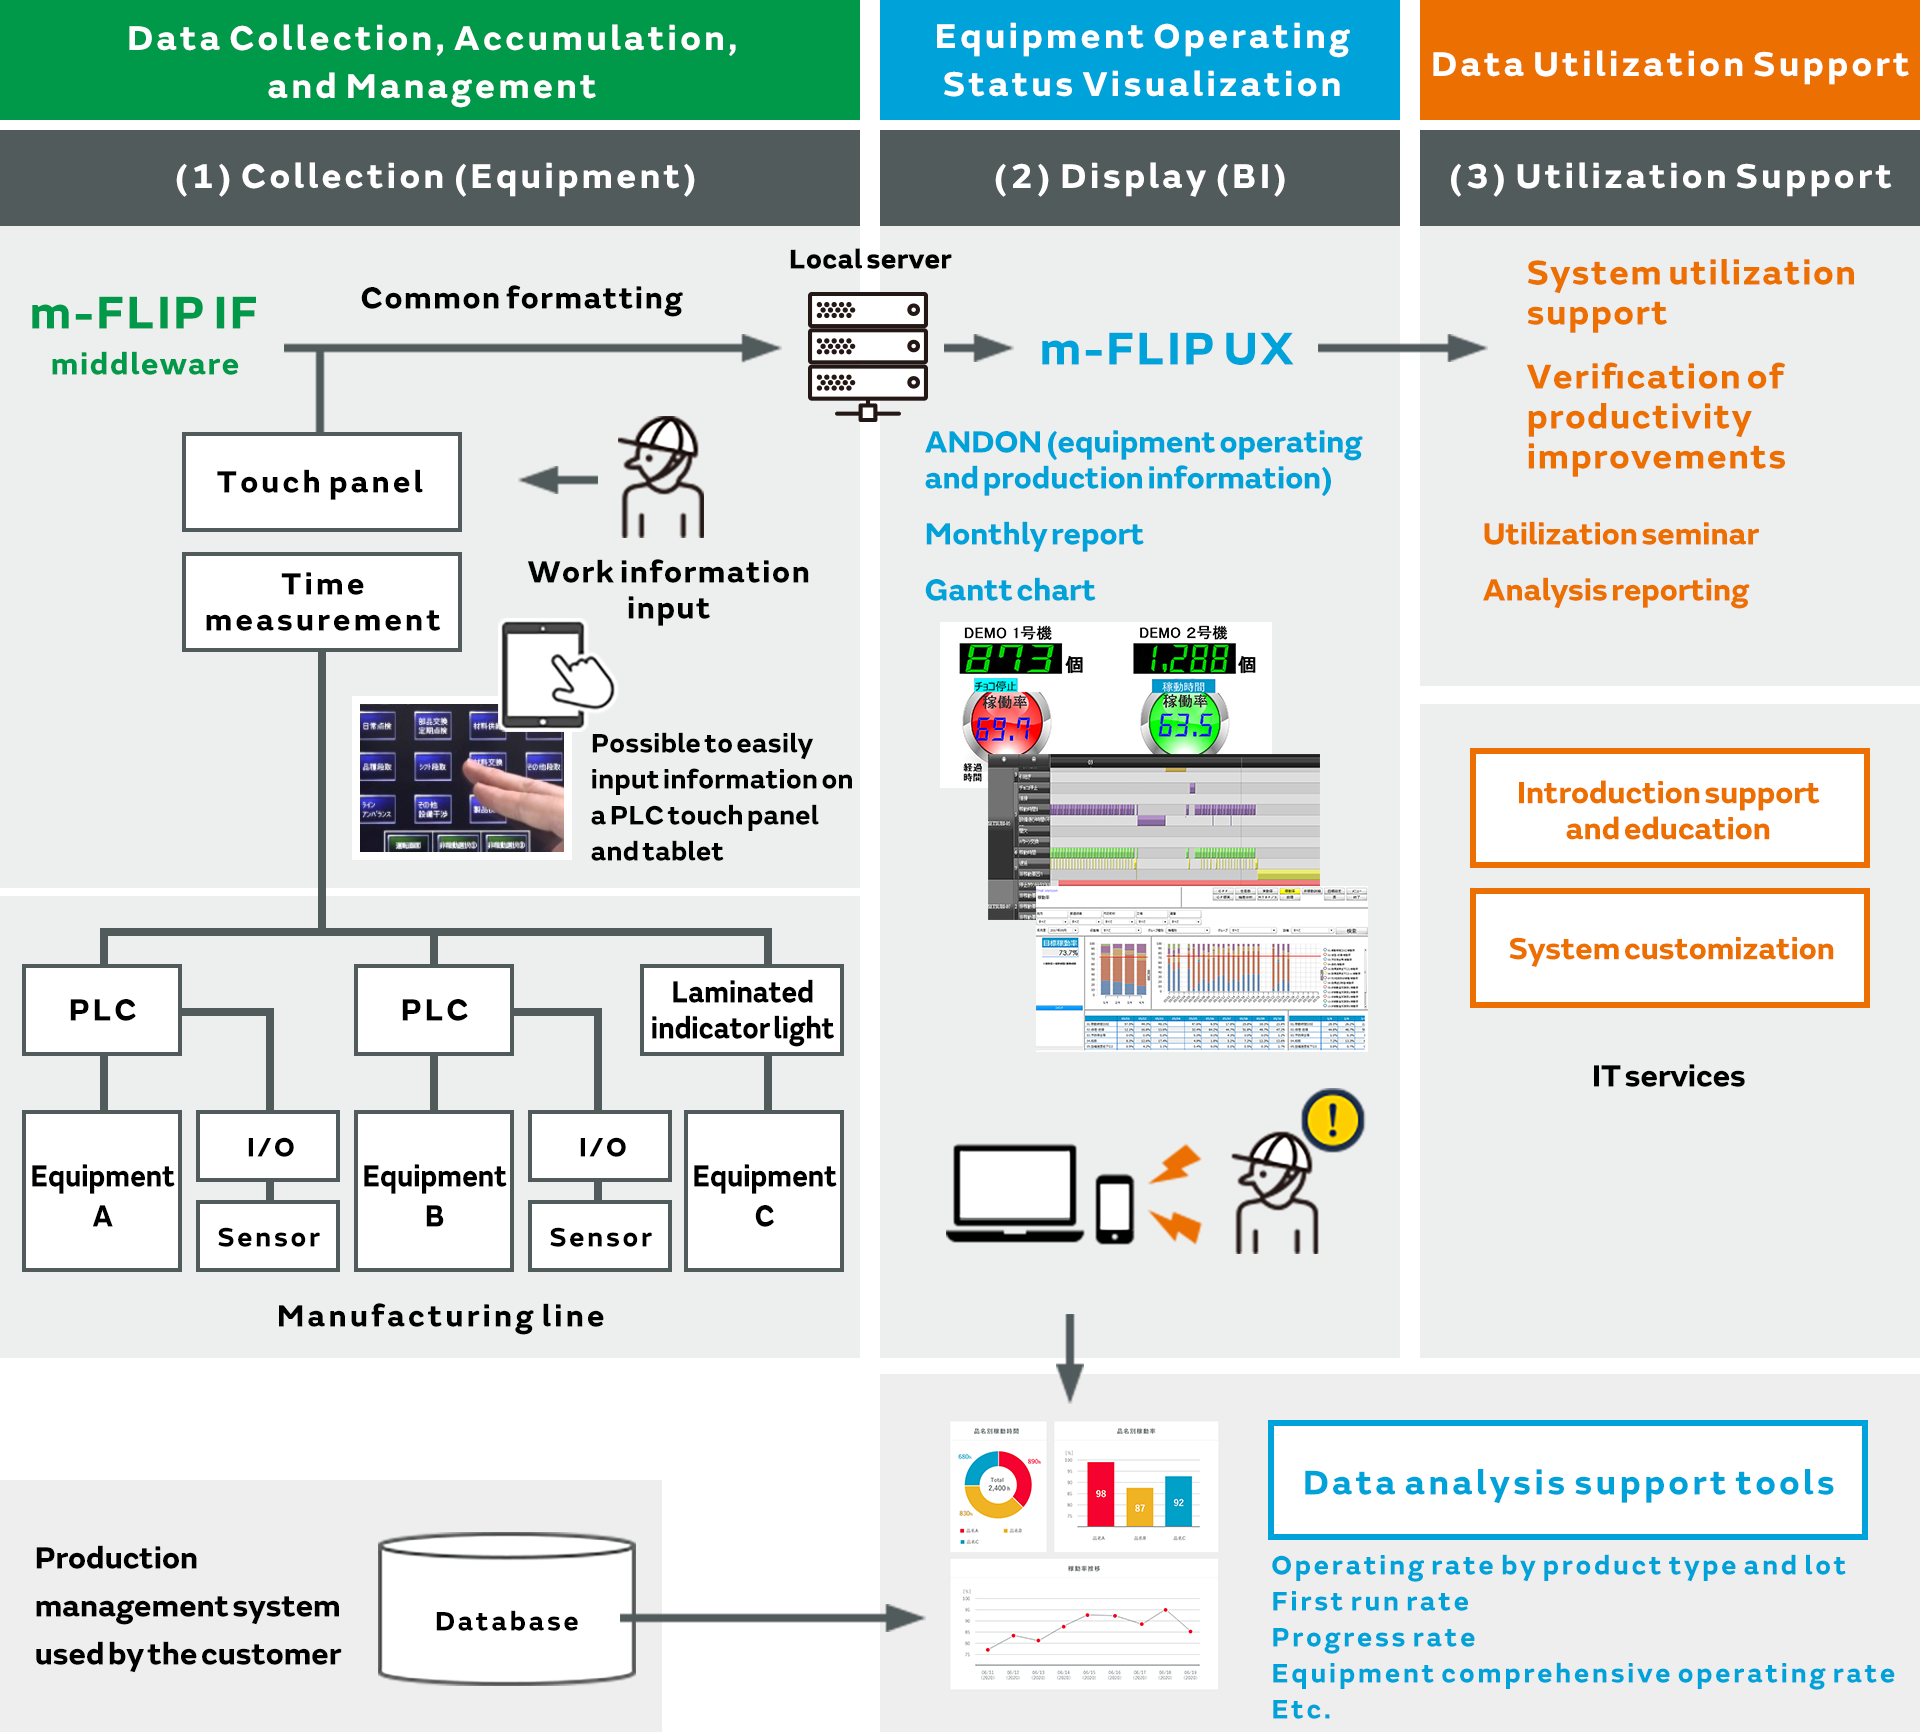
We need data on the operating status of equipment to reduce short stoppages. For that, we must be able to accurately and quickly record the equipment stoppage times due to the frequent short stoppages and their causes. We introduce here the m-FLIP solution tool that helps to resolve such issues.
m-FLIP is a solution that combines Murata Manufacturing’s worksite improvement know-how and IT technologies to maximize the operating rate of manufacturing devices. This solution makes it possible to quantify factors such as operating rate, actual working rate, and equipment stoppages to increase production and achieve optimal maintenance. This greatly contributes to the visualization of problems that are difficult to reveal such as short stoppages.
Furthermore, m-FLIP calculates and outputs the operating rate and actual working rate based on data obtained from PLCs made by multiple manufacturers. In addition, it collects workers’ work information through touch-panel PCs. As a result, we can clarify the duration and number of equipment stoppages, which was previously done by guesswork. We are also able to clearly see the main causes of equipment stoppages and the issues that must be resolved (Fig. 7).
m-FLIP can support the resolution of various issues at manufacturing worksites. We introduce here some typical utilization examples.
With checks by humans, it is only possible to monitor the operating status temporarily. However, m-FLIP can continuously monitor the operating status of equipment. It is possible to continuously collect data over several months or several years. This allows us to grasp the aging and changes over time of equipment. As a result, it enables maintenance at the optimal timing while minimizing the impact on the operating rate to the greatest possible extent.
For example, it is possible to monitor static electricity generation status based on data from temperature sensors and humidity sensors around the equipment and to output an alert when the set threshold is exceeded. We can utilize this in quality control such as to prevent the outflow of defective products. Moreover, we can also collect data including information on vibrations, current, and voltage. We can then integrate the data we have obtained from multiple sensors and output it as a single piece of information.
We can grasp the movements of workers and the operating status of equipment as quantified information. Therefore, we can also utilize it to consider work procedure reviews, equipment improvements, and personnel allocation optimization.
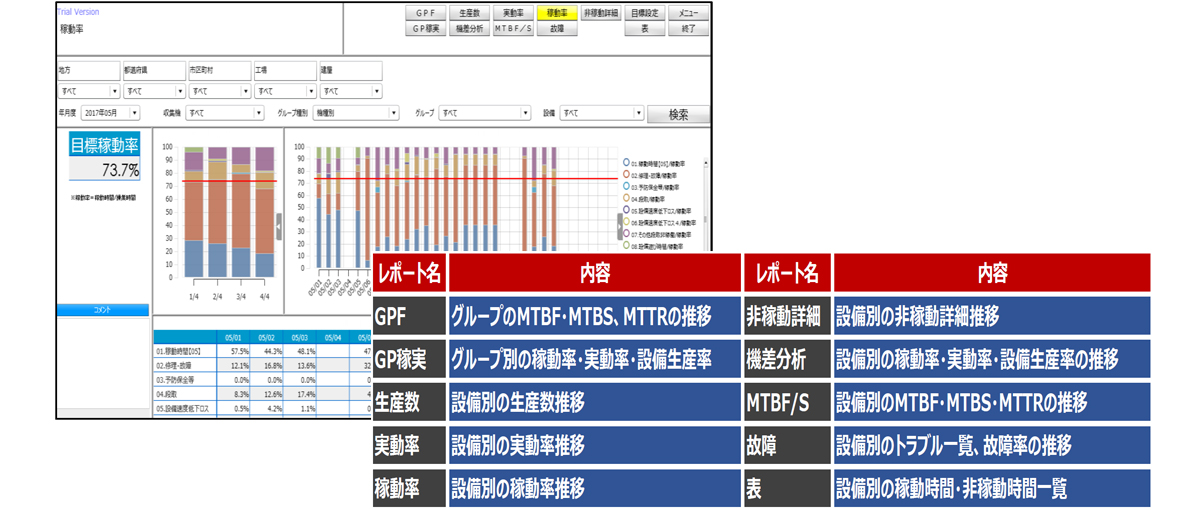
m-FLIP comes with a function to prepare reports that can be used for reporting (Fig. 8). You can display information in charts and tables. It is also possible to input and save comments. You can share the reports you have prepared.
After introducing m-FLIP, we can identify issues from the data we have collected and receive suggestions for improvements and other advice from professionals familiar with production technologies, factory technologies, and other technologies.
We now introduce a case study from Ogaki Murata Manufacturing in which they resolved frequently occurring problems including short stoppages due to tray replacement in the product-washing process and short stoppages due to component adhesion errors with the m-FLIP operating rate improvement solution tool.
We intuitively knew that short stoppages were occurring in the tray/rack refilling machine at the manufacturing worksite. However, we were not able to quantify the stoppage time or the number of stops. Accordingly, we collected data on the tray/rack refilling machine and the component adhesion device with m-FLIP. We uncovered the following problems as a result.
・Non-operation due to waiting for tray replacement: 12%
・Non-operation due to adhesion errors: 8%
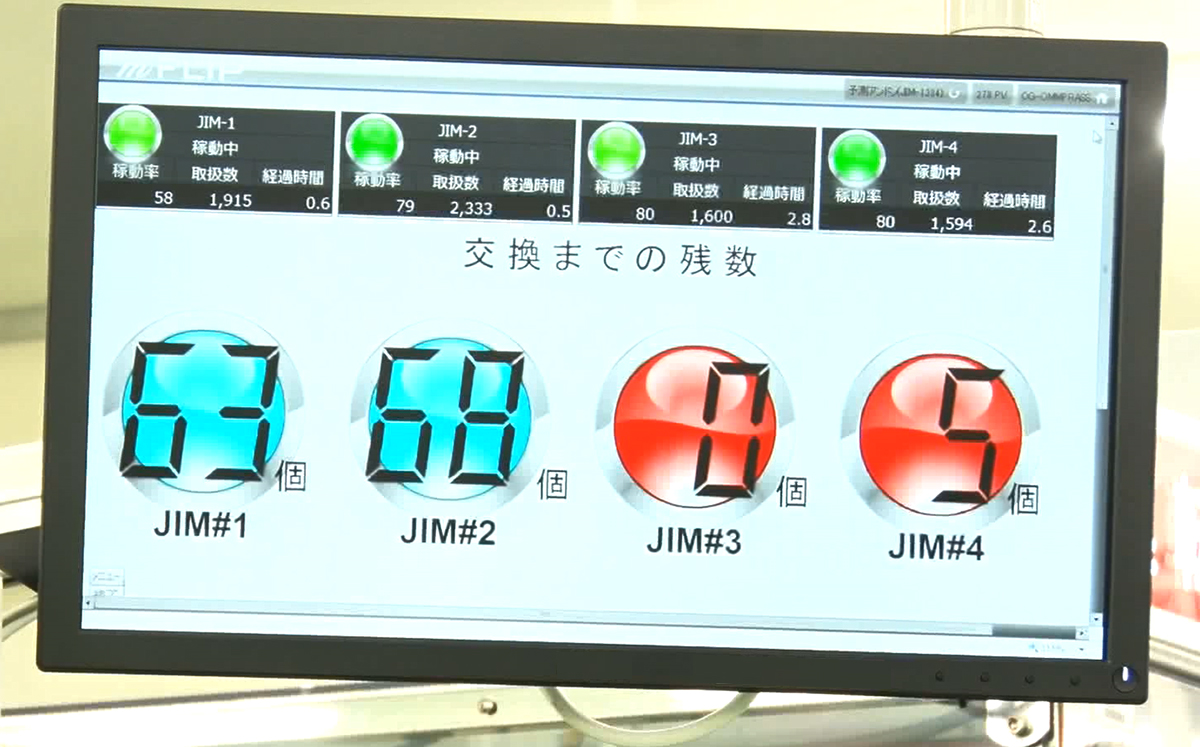
We now display on ANDON the number of trays remaining until the completion of the tray replacement (Fig. 9). We display in ANDON the timing of the tray replacement before the work of refilling the product into the tray is complete. This has meant we have been able to greatly reduce the time spent waiting for tray replacement.
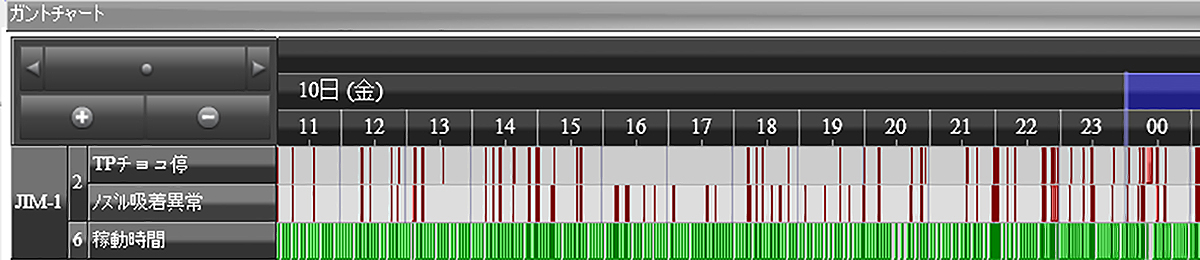
We analyzed in detail the contents of the short stoppages. As a result, we ascertained that 80% or more of the short stoppages were component adhesion errors (Fig. 10 and Fig. 11).
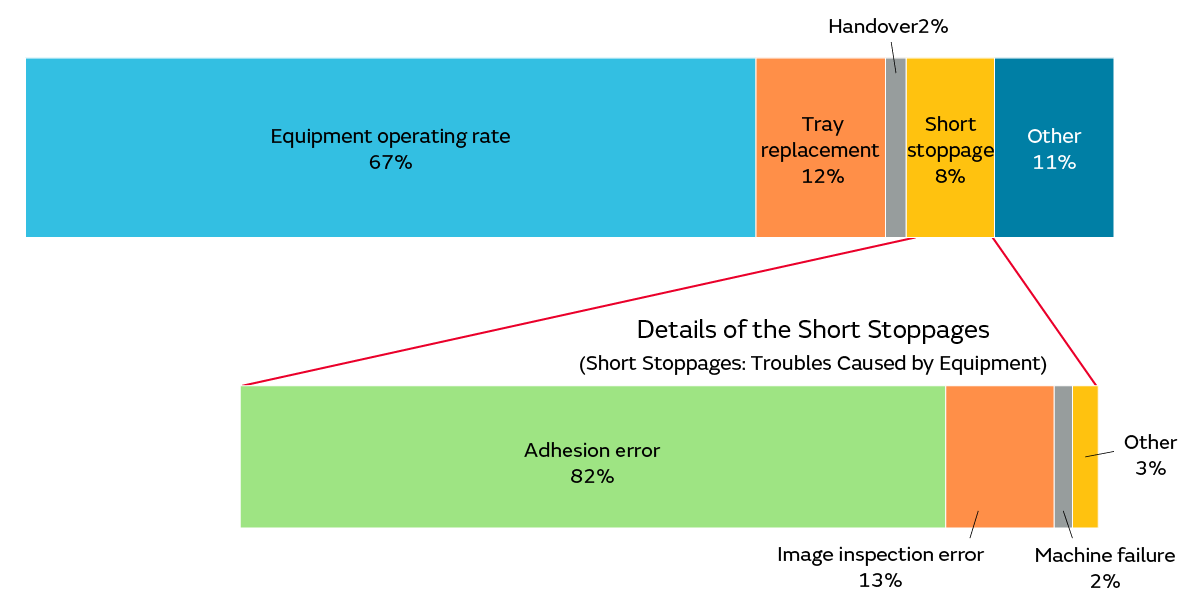
We found that the cause of the component adhesion errors was changes in the clearance between the product adhesion nozzle and product due to changes over time in the washing rack jig. As a countermeasure, we shortened the gap between the adhesion nozzle and the product. This allowed us to significantly reduce short stoppages due to adhesion errors.
In this way, it is first necessary to digitize the operating status of equipment and the behavior of workers to improve short stoppages. We can pursue the causes of short stoppages by analyzing and parsing the data we collect.
This questionnaire revealed issues in the conversion of regular factories into smart factories and challenges in promoting that in numerical data. We can see that quantifying and visualizing the various losses lurking in production lines is essential for improving productivity from these results. We focused on the theme of short stoppages this time. However, quantified data is also indispensable to resolve other issues in the conversion of regular factories into smart factories. The questionnaire results show that this requires high density and quality of the data to be collected as well as analytical skills.