
Equipment maintenance DX by sensor data × data analysis
Part 2: How to Proceed with Data Analysis in Predictive Maintenance
In the first article of the "Equipment Maintenance DX by Sensor Data × Data Analysis" series, we provided an overview of Predictive Maintenance (PdM), which has attracted attention in recent years in the equipment maintenance field, and explained the key points when implementing it.
There are a number of key points to consider when implementing PdM, one of which is "selection of appropriate data analysis methods." The objective of data analysis in PdM is to properly detect signs of equipment deterioration that appear in sensor data. In order to achieve this, it is extremely important to carefully observe the sensor data, understand the characteristics of the fluctuation patterns caused by equipment deterioration, and select data analysis methods that are suitable for those characteristics.
In this second article of the "Equipment Maintenance by Sensor Data × Data Analysis" series, we will focus on data analysis for predictive maintenance, and explain in an easy-to-understand manner the frequently used data analysis technologies and methods, and the process involved in performing data analysis (from data collection by sensors to selection of data analysis methods).
INDEX
1. Data Analysis Technologies and Specific Methods Used in PdM
2. How to Proceed with Data Analysis in PdM
[Step 1] Collect data by sensors
[Step 2] Find and classify anomalous patterns
[Step 3] Select the data analysis technology
1. Data Analysis Technologies and Specific Methods Used in PdM
Table 1 lists the data analysis technologies that are frequently used in PdM. In addition to these, there are also other data analysis technologies such as failure classification that classifies failure sites and types. However, if you are going to implement equipment maintenance DX, it is best to first consider the technologies in Table 1. That said, only some specific methods are shown below, and various methods have in fact been proposed, so there is no shortage of options.
Data analysis technology | Characteristics | Examples of specific methods*1 |
|---|---|---|
Outlier detection | Judgment based on the number of | ・k-nearest neighbor algorithm (k-NN) |
Anomaly detection | Judgment based on the degree of | ・k-nearest neighbor algorithm (k-NN) |
Change detection | Judgment based on the degree of | ・k-nearest neighbor algorithm (k-NN) |
*1 The explanation in this article focuses on how to proceed with data analysis, so explanations of specific methods will be omitted here.
However, it is not a good idea to suddenly select a data analysis technology or specific method from Table 1. In many cases, the initially selected method is not appropriate, resulting in a lot of rework, which ends up wasting cost and time spent on examination.
In order to realize Predictive Maintenance by Sensor Data × Data Analysis, it is essential to select and apply technologies and methods from the table above that are appropriate to the equipment to be maintained and the obtained sensor data.
2. How to Proceed with Data Analysis in PdM
The flow of data analysis used in PdM is explained below according to Fig. 1.

[Step 1] Collect data by sensors
Data analysis cannot begin without sensor data to be analyzed. Select and install the appropriate sensors according to the equipment to be maintained, and make sure that data is collected properly as originally intended.
[Step 2] Find and classify anomalous patterns
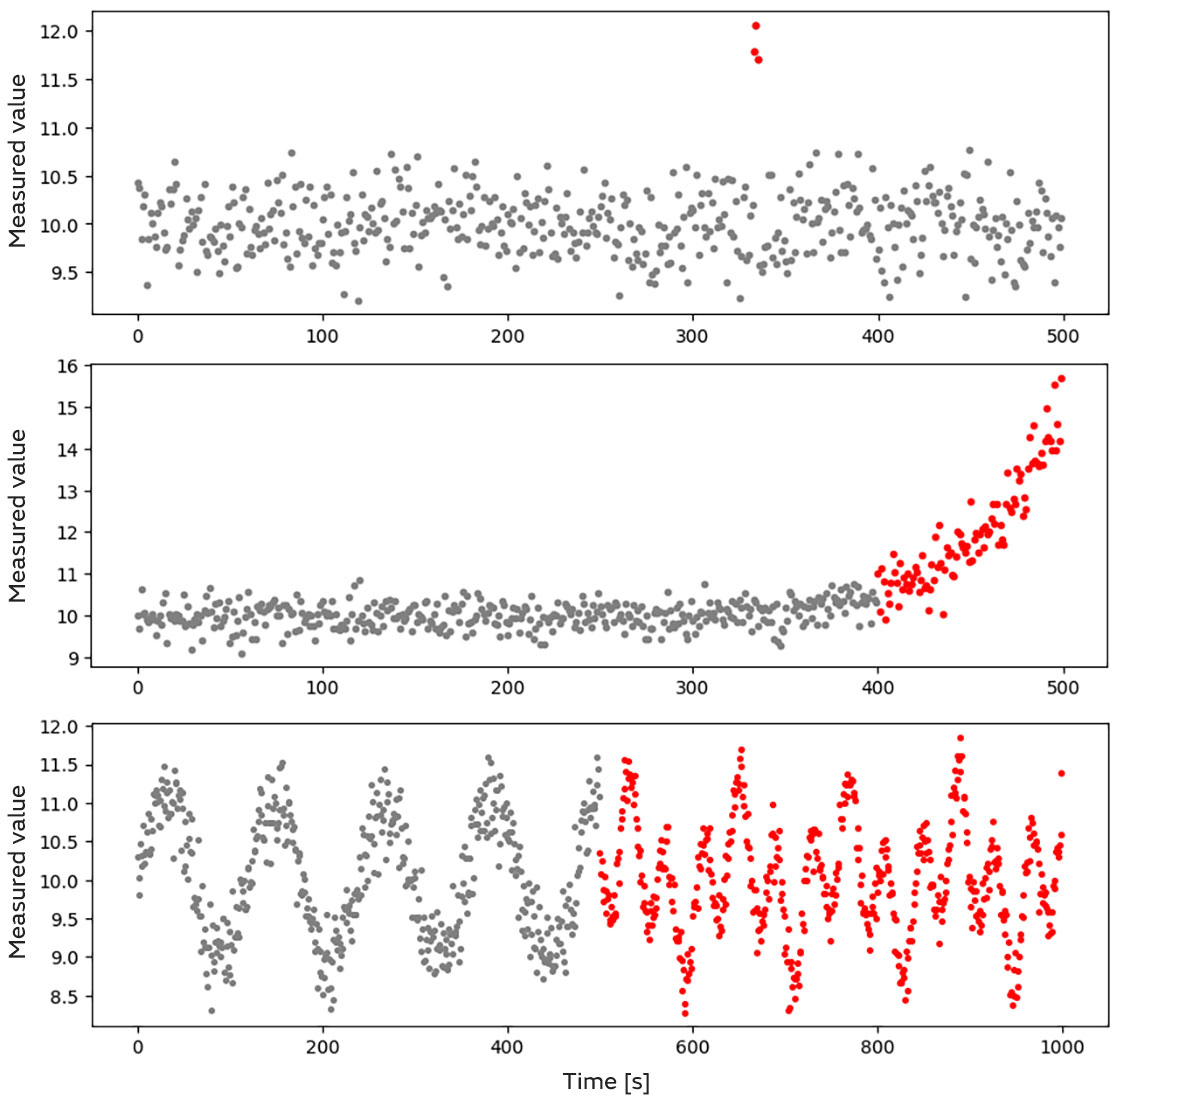
Next, find and classify anomalies*2 that appear in the collected data. Here, Fig. 2 shows examples of typical anomaly patterns that appear in sensor data.
There are many methods for performing Step 2, but the most basic and effective methods are data visualization and visual observation. Which pattern classification in Fig. 2 the anomaly observed in this step falls into is an important criterion for selecting a more appropriate data analysis method (see Step 3).
The explanation hereinafter will proceed with the assumption that an anomaly*2 rooted in the cause we want to detect, such as equipment deterioration or failure, was found and classified.
*2 "Anomaly" targeted by this article
Anomalies that appear in sensor data cover "anything that differs from the sensor data values or time series trend measured in the normal equipment operating state," and has the following two meanings.
(a) Anomalies due to changes caused by equipment deterioration or breakdown
(b) Anomalies due to changes caused by factors other than (a) above
(e.g. Changes in personnel, manufacturing machinery, materials, methods, etc. due to operational improvement and equipment repair)
(a)-type anomalies are often the detection target in PdM, so this explanation in this article will focus on (a)-type anomalies.
In actual operation, it is necessary to understand whether a change that appears in the sensor data values is an (a)-type or (b)-type anomaly. However, it is generally difficult to determine the anomaly category just from the sensor data, so refer to maintenance records and other data as appropriate when making judgments.
[Step 3] Select the data analysis technology
Once the anomaly pattern is understood in Step 2, the process enters the data analysis technology selection phase. As mentioned above, the anomaly pattern that appears is a key criterion for selecting the data analysis technology to be applied, so the data analysis technology suitable for each pattern shown in Fig. 2 is introduced below.
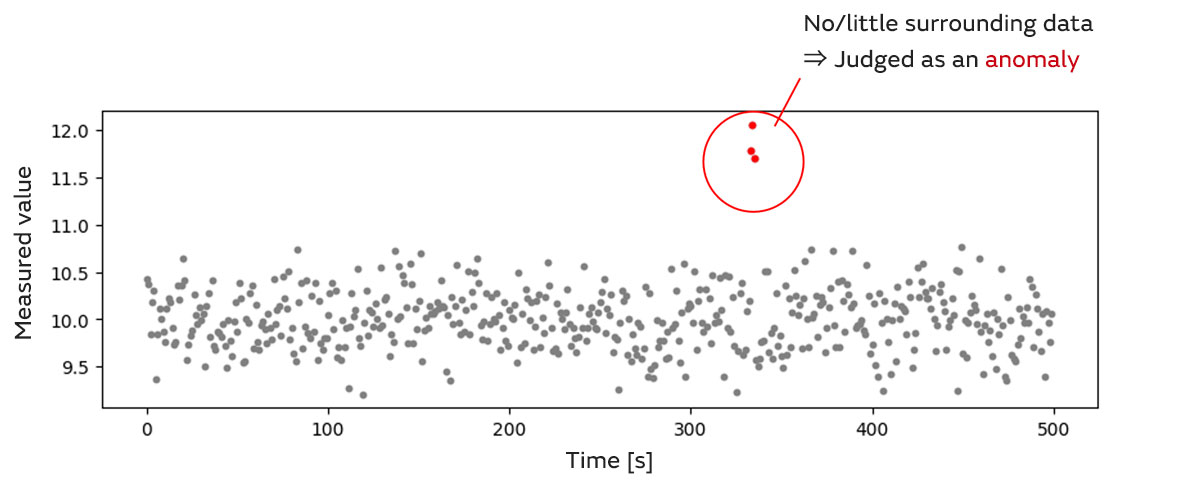
(1) Anomalies that appear as sudden outliers (Fig. 2 top)
If an anomaly appears in the form of sudden outliers, consider applying the data analysis technology called outlier detection. In outlier detection, an anomaly is determined when there is no or little data around the target data (Fig. 3). Note that if a normal label can be assigned, the anomaly detection in [Step 3] (2) below can also be applied.
- Feature: There is no need to label the data as normal or anomalous, so the difficulty of data collection in order to apply the technology is low.
- Caution: There is a high risk of false positives whereby normal data is mistakenly judged as an anomaly.
(2) Anomalies that appear as drift (Fig. 2 middle)
If an anomaly involves continuous change such as drift, outlier detection cannot be applied, and anomaly detection should be considered. In anomaly detection, anomalies are determined based on the degree of deviation from the normal pattern (Fig. 4).
Using the same approach, if there is sufficient anomaly data, failure detection can also be considered, which determines anomalies based on the similarity with that pattern. However, this requires a certain amount of anomaly data, and such situations are generally not common, so care should be taken for application.
- Feature: Anomalies are detected based on the degree of deviation from or similarity to the normal pattern, making it possible to respond to changes such as drift.
- Caution: As it is necessary to define the normal pattern used as the reference source and to assign labels, the difficulty and cost of collecting and organizing data is somewhat higher than that of outlier detection.
(In the case of failure detection) Application can be considered only when sufficient anomaly data derived from equipment deterioration or failure can be obtained.

(3) Anomalies that appear as a change in trend (Fig. 2 bottom)
In case of an anomaly where the range of data does not differ greatly from that of normal operation and there is only a change in the trend (slope, period, fluctuation pattern, etc.), it may be difficult to apply outlier detection or anomaly detection, which judge using only a single data. In this case, consider applying change detection.
Unlike the previously mentioned technologies, change detection uses a format in which multiple data are evaluated together. By comparing the data group to be judged with the data group of a slightly previous time, it is possible to check for a change in trend (Fig. 5).
Change detection also includes an approach that detects only when the range of data is continuously outside that of normal operation. This is useful when the characteristics of the equipment and the measurement subject are such that a single outlier can occur even in normal operation.
- Feature: Specialized in detection of anomalies where a change in trend occurs continuously to some extent.
- Caution: It is not suitable for detection of sudden and isolated anomalies.

[Step 4] Select the data analysis method
After selecting the data analysis technology, the next step is to select the specific method. As it is not realistic to cover all the criteria for selecting methods, two points that should generally be considered when selecting methods are introduced below.
Prerequisites assumed by the method
A typical example would be a method that assumes that the data will follow a specific distribution. If that premise is not met, there is the risk of falling into a situation where anomalies cannot be properly detected. For example, the Mahalanobis-Taguchi method shown in Table 1 as an example of a specific anomaly detection method can be applied in various situations, but it assumes that the data follow a normal distribution. Therefore, even if this method is selected simply because it is widely used, it will not be possible to properly detect anomalies if the data do not follow a normal distribution. For this reason, make sure that your data meets the prerequisites.
Interpretability of the method
The ultimate objective of data analysis is PdM, so if an anomaly is judged, it is up to humans to decide whether to perform maintenance based on the results. With this point in mind, it could be considered preferable to use a method that makes it easier to interpret the basis for judging an anomaly in order to perform maintenance.
However, there are also cases where there is a trade-off between the interpretability of the method and the ability to detect anomalies. Which one should be prioritized is decided on a case-by-case basis, so the data analyst and the person performing PdM should coordinate fully and ensure that there is no inconsistency in mutual awareness.
3. Conclusion
This article explained the typical data analysis technologies and methods used in PdM, and their selection process.
It can be said that the key to selecting a data analysis method is to not start by suddenly selecting a method. Rework can be reduced if you start by carefully checking whether the intended data is acquired by the sensor and what kind of characteristics the observed anomaly has. Once this step is cleared, the technology and the specific method to be applied should become apparent one after another.
Nowadays, the scope tends to be focused on analysis methods such as machine learning and deep learning. However, in order to realize PdM through "sensor data × data analysis," it is most important to have a firm grasp of not only various analysis methods, but also the basic items that should be kept in mind in order to select the appropriate method.